Why OfficeReports?
✔ Save Hours on Reporting – Quickly populate tables and charts in PowerPoint using an intuitive drag & drop interface. No more time-consuming manual work.
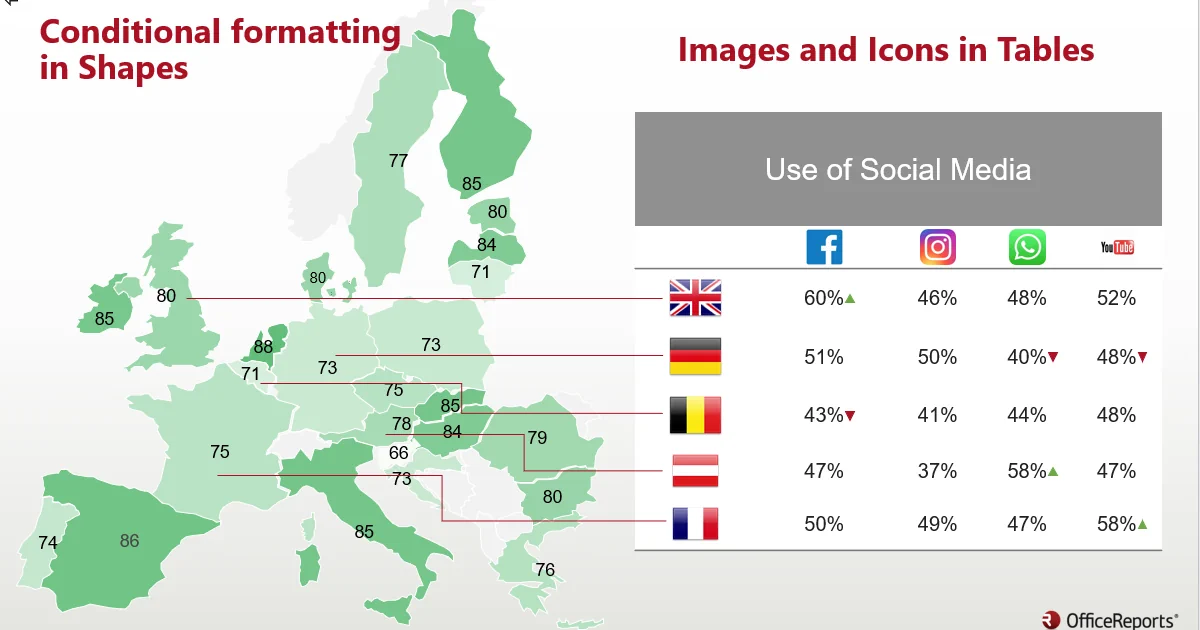
✔ The Best Tool for Handling Tables – OfficeReports automatically adjusts the number of rows and columns based on your data, ensuring tables always fit perfectly.
✔ Smart Visualization Enhancements – Automatically add up/down arrows, highlight trends and significant difference, or convert text into images to make your reports stand out.
✔ Tracking Study Automation – Quickly update charts and tables across waves.
✔ Copilot – AI-powered automation for creating tables and populating PowerPoint. Copilot generates tables in Excel and seamlessly updates PowerPoint tables and charts with the results.
✔ Interactive Dashboards – Instantly filter tables and charts in Slide Show mode
✔ No More Copy-Paste Errors – Eliminate manual mistakes with seamless integration between Excel/SPSS and PowerPoint. Your reports are always accurate.