Edit the Table definition

You can edit a table in the OfficeReports App by double-clicking a cell of the table. In Excel the 'Table Pane' will appear as soon as you click in a cell of the table.
In the Edit Table window or the Table Pane you can change all the table settings. Click on the topics below to read more about them:
In the `Filter´ tab, you can define a table filter. The categories you check are part of the data used. For example, checking the categories `Finance, ‘HR’ and ’Marketing’ will exclude the categories not checked.
If you need a filter based on multiple variables, create a derived variable first. This derived variable should contain a category containing the data you need to use in your filter.
For filtering entire reports, see the Report Filter section.
Any combination of categories from any specific categorical variable can be used as a filter, even if it is a derived variable.
If a table includes a category that has been filtered out, the name of the category is still displayed but the number of observations or responses will (naturally) be zero. In order, not to display a category that has been filtered out from the table, check the option `Do not show´ in the `Options´ box:

Ignoring Filters
The ignored filters will be ignored when calculating the table. Useful for Report Automation like mass-generating reports.
Add a filter declaration
When defining a filter to a table we can optionally add the filter declaration to the title in the table by checking 'Add to title'
In the ‘Filter’ tab there is an option to ignore the Report Filter or any of the Hierarchy Filters.
Example: When creating reports for each different department, we might have a table where we show information for the whole company. In that table we want to ignore the department filter, which could have been defined as e.g. the report filter or a hierarchy filter.
In the ’Statistics’ tab of the Table Definition we can define Z- test and T-test for tables. Read more about Significance Testing.

Weighting
We use weighted data by specifying a Weight Variable. This can be a numeric variable you have imported, or it can be a numeric weight variable calculated by OfficeReports. The section Weighting Data describes how to calculate case weights resulting in a numeric variable.
If need to weight all or most of your tables, you can select a Default Weight Variable in ‘OfficeReports>General Settings’.
OfficeReports can sort both rows and columns either ascending or descending or in the same order as another table. In fact, it does not have to be a table, any 'Named Range' in excel will work. Video: Sort in Same Order as...

In case you are using a 'Reporting Table Layout' which is available when you are in Reporting Mode, you will have the option to sort the Mean or the Total together with the categories.

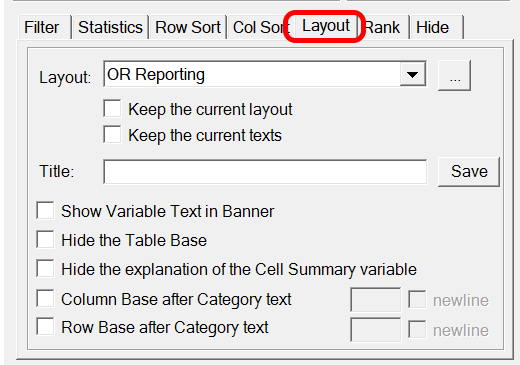
OfficeReports default uses the layout as defined in the "Layout Settings". You can overrule the layout for the individual tables by selecting one of the layouts in the 'Layout' list..
Title – frequency tables
For tables just containing one variable OfficeReports default uses the variable text as table title. This can be overruled by adding an alternative title in the 'Title' field.
Title – cross tables
For tables containing two variables (variable and optional variable) there are a number of alternatives how to process a title:
For each table OfficeReports will display a default table layout type. The default layout type can be overruled by selecting an alternative type. Defaults and alternatives are defined in the Layout section.
The title can be:
-
Variable text
-
Optional variable text
-
Variable text x Optional variable text
-
Optional variable text x Variable text
-
User defined title

The default setting for the title is defined in the Layout section.
Hide the explanation of the Cell Summary variable
For tables containing summary statistics in the cells, OfficeReports default adds this information to the title. A click and this explanation can be hidden.
In the Table Pane we can now edit tables to show a ranking, which for each category means which rank this category has compared to other categories.
The feature works for frequency -, cross – and grid tables and it works with percentages/observations as well as with numeric info in cells.
The ranking can be displayed row or column wise, and the order can be either ascending or descending.

Finally, you can choose to display the ranking just for categories with a minimum base of # observations.
The output could be something like this, where we want to express which of the department doing best on different dimensions. Here the ranking is based on Mean-values, but it could as well have been based on i.e. Top-2 Values:

Note: The table shows i.e. ‘1 of 5’. If ‘out of’ is preferred, this setting can be made in ‘Table Settings’. Alternatively, OfficeReports can show ‘Only Rank Number':

‘Hide’, will hide the selected categories. In contrast to ‘Filter’, the results of the calculations are still the same:

not in range COMPSET
This feature was created to be able to show a brand compared to it's competitors (the CompSet), which differs from country to country. To use this feature, give a range in Excel the name 'COMPSET' (select the range, right-click and choose 'Name'), and make sure this range contains all the brands you need for a specific country report. A check in 'not in range COMPSET' will hide all brands which are not mentioned in the COMPSET range.